Adjusted EBITDA¹,³ rises 27.6% year-on-year to US$35.2 millionSINGAPORE, May 26 (Bernama-BUSINESS WIRE) -- TDCX Inc. (NYSE: TDCX) (“TDCX” or the “Company”), an award-winning digital customer experience (CX) solutions provider for technology and blue-chip companies, today announced its unaudited financial results for the first quarter ended March 31, 2022.
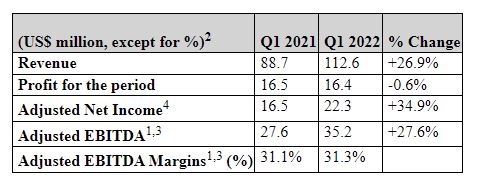
First Quarter 2022 Financial Highlights· Total revenue of US$112.6 million, representing 26.9% year-on-year growth
· Profit for the period was US$16.4 million, which included a US$5.9 million equity-settled share-based payment expense under the TDCX Performance Share Plan
· Adjusted Net Income
⁴ of US$22.3 million, representing 34.9% year-on-year growth
· Adjusted EBITDA
¹,³ of US$35.2 million, representing 27.6% year-on-year growth
· Q1 2022 Adjusted EBITDA margin
¹,³ of 31.3%, compared with 31.1% for Q1 2021
· Q1 2022 Net Cash from Operating Activities of US$37.1 million, representing 188.1% year-on-year growth
Mr. Laurent Junique, Chief Executive Officer and Founder of TDCX, said, “Despite the volatile operating environment, we stayed focused on executing and delivering our plans to achieve a strong first quarter performance. Our performance demonstrates the grit and resilience of our people and the strong foundation that we have built for our business.
“Since our last earnings announcement, we have added new key clients, including a leading global short-form video social media platform and a leading Southeast Asia e-commerce platform. Later this month, TDCX will also be included
⁵ in the MSCI Global Small Cap Index.
“Looking ahead, growing geopolitical and economic instabilities may create headwinds for our business, primarily in the short term. However, we remain optimistic about our market opportunities and long-term growth potential.”
Business HighlightsStrong Client Additions· Added 10 new logos in Q1 2022, more than double the four logos added in Q1 2021
· New logo wins include a leading global short-form video social media platform, as well as a leading Southeast Asia e-commerce platform
· 55 clients as of March 31, 2022, a 41% increase as compared with 39 clients as of March 31, 2021
· Revenue contribution from new economy
⁶ clients stood at 93% for Q1 2022
Strengthened Capabilities through Continued Geographic Expansion· Reinforced Global English capabilities with the launch of a new campus in Hyderabad, India. The 45,000 square foot office is located at Sky View 20, within the heart of the Hyderabad Information Technology and Engineering Consultancy City. The campus complements TDCX’s wide footprint of delivery centers across Asia, parts of Europe and a Latin America site to serve domestic, regional and global markets.
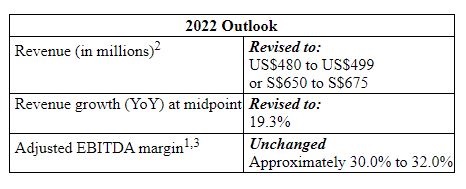
Full Year 2022 OutlookFor the full year 2022, TDCX expects its financial results to be:
______________________
¹ Adjusted EBITDA or Adjusted EBITDA margins are supplemental non-IFRS financial measures and should not be considered in isolation or as a substitute for financial results reported under IFRS (see "Reconciliations of non-IFRS financial measures to the nearest comparable IFRS measures" in the Form 6-K or presentation slides for more details).
² FX rate of US$1 = SG$1.3534 assumed in converting financials from SG dollar to US dollar.
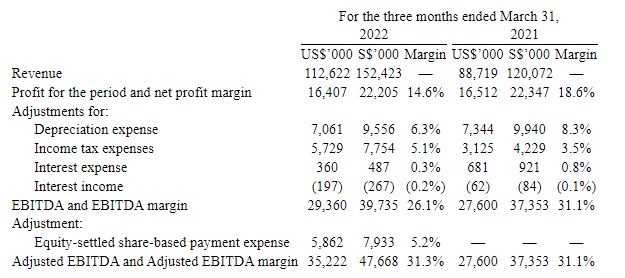
³ Adjusted EBITDA represents profit for the period before interest expense, interest income, income tax expense, depreciation expense and equity-settled share-based payment expense incurred in connection with our Performance Share Plan. “Adjusted EBITDA margin” represents Adjusted EBITDA as a percentage of revenue.
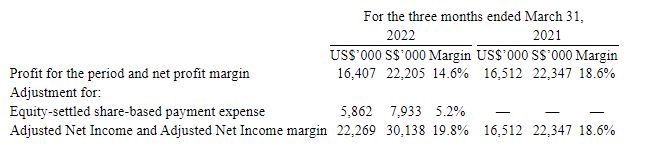
⁴ “Adjusted Net Income” represents profit for the period before equity-settled share-based payment expense incurred in connection with our Performance Share Plan, net of any tax impact of such adjustments. “Adjusted Net Income margin” represents Adjusted Net Income as a percentage of revenue.
⁵ See news release: TDCX to be included in the MSCI Global Small Cap Index
⁶ “New economy” refers to high growth industries that are on the cutting edge of digital technology and are the driving forces of economic growth.
Webcast and Conference Call InformationThe TDCX senior management will host a conference call to discuss the first quarter 2022 unaudited financial results.
A live webcast of this conference call will be available on TDCX’s website. Access information on the conference call and webcast is as follows:
Date and time:
May 25, 2022, 8:00 AM (U.S. Eastern Time)
May 25, 2022, 8:00 PM (Singapore / Hong Kong Time)
Webcast link:
https://webinars.on24.com/q4/TDCX_Q1_2022Dial in numbers:
USA Toll Free: +1 855 2656958
UK Toll Free +44 0 800 0156371
Singapore: +65 3158 0246
Hong Kong: +852 5808 0984
International: +1 718 7058796
A replay of the conference call will be available at TDCX’s investor relations website (investors.tdcx.com). An archived webcast will be available at the same link above.
About TDCX INC.Singapore-headquartered TDCX provides transformative digital CX solutions, enabling world-leading and disruptive brands to acquire new customers, to build customer loyalty and to protect their online communities.
TDCX helps clients achieve their customer experience aspirations by harnessing technology, human intelligence and its global footprint. It serves clients in fintech, gaming, technology, home sharing and travel, digital advertising and social media, streaming and e-commerce. TDCX’s expertise and strong footprint in Asia has made it a trusted partner for clients, particularly high-growth, new economy companies, looking to tap the region’s growth potential.
TDCX’s commitment to delivering positive outcomes for our clients extends to its role as a responsible corporate citizen. Its Corporate Social Responsibility program focuses on positively transforming the lives of its people, its communities and the environment.
TDCX employs more than 14,000 employees across 26 campuses globally, specifically Singapore, Malaysia, Thailand, Philippines, Mainland China, Hong Kong, South Korea, Japan, India, Romania, Spain and Colombia. For more information, please visit
www.tdcx.com.
Convenience TranslationThe Company’s financial information is stated in Singapore dollars, the legal currency of Singapore. Unless otherwise noted, all translations from Singapore dollars to U.S. dollars and from U.S. dollars to Singapore dollars in this press release were made at a rate of S$1.3534 to US$1.00, the approximate rate in effect as of March 31, 2022. We make no representation that any Singapore dollar or U.S. dollar amount could have been, or could be, converted into U.S. dollars or Singapore dollar, as the case may be, at any particular rate, the rate stated herein, or at all.
Non-IFRS Financial MeasureTo supplement our consolidated financial statements, which are prepared and presented in accordance with IFRS, we use the following non-IFRS financial measure to help evaluate our operating performance:
“EBITDA” represents profit for the period before interest expense, interest income, income tax expense and depreciation expense. “EBITDA margin” represents EBITDA as a percentage of revenue. “Adjusted EBITDA” represents profit for the period before interest expense, interest income, income tax expense, depreciation expense and equity-settled share-based payment expense incurred in connection with our Performance Share Plan. “Adjusted EBITDA margin” represents Adjusted EBITDA as a percentage of revenue. We believe that EBITDA, EBITDA margin, Adjusted EBITDA and Adjusted EBITDA margin helps us to identify underlying trends in our operating results, enhancing our understanding of past performance and future prospects.
“Adjusted Net Income” represents profit for the period before equity-settled share-based payment expense incurred in connection with our Performance Share Plan, net of any tax impact of such adjustments. “Adjusted Net Income margin” represents Adjusted Net Income as a percentage of revenue.
The above non-IFRS financial measures have limitations as analytical tools and should not be considered in isolation or construed as an alternative to revenue, net income, or any other measure of performance or as an indicator of our operating performance. The non-IFRS financial measures presented here may not be comparable to similarly titled measures presented by other companies because other companies may calculate similarly titled measures differently. For more information on the non-IFRS financial measures, please see the form 6-K section captioned “Non-IFRS Financial Measures” or the presentation slides.
Safe Harbor StatementThis announcement contains forward-looking statements. These statements are made under the “safe harbor” provisions of the U.S. Private Securities Litigation Reform Act of 1995. In some cases, you can identify these forward-looking statements by the use of words such as “outlook,” “believes,” “expects,” “potential,” “continues,” “may,” “will,” “should,” “could,” “seeks,” “predicts,” “intends,” “trends,” “plans,” “estimates,” “anticipates” or the negative version of these words or other comparable words. Among other things, the outlook for the full year, the business outlook and quotations from management in this announcement, as well as the Company’s strategic and operational plans, contain forward-looking statements. The Company may also make written or oral forward-looking statements in its periodic reports to the U.S. Securities and Exchange Commission (the “SEC”), in its annual report to shareholders, in press releases and other written materials and in oral statements made by its officers, directors or employees to third parties. Statements that are not historical facts, including statements about the Company’s beliefs and expectations, are forward-looking statements. Forward-looking statements involve inherent risks and uncertainties. A number of factors could cause actual results to differ materially from those contained in any forward-looking statement, including but not limited to the following: the performance of TDCX’s largest clients; the successful implementation of its business strategy; its ability to compete effectively; its ability to maintain its pricing, control costs or continue to grow its business; the effects of the novel coronavirus (COVID-19) on its business; the continued service of its founder and certain of its key employees and management; its ability to attract and retain enough highly trained employees; its exposure to various risks in Southeast Asia; its contractual relationship with key clients; clients and prospective clients’ spending on omnichannel CX solutions; its spending on employee salaries and benefits expenses; and its involvement in any disputes, legal, regulatory, and other proceedings arising out of its business operations. Further information regarding these and other risks is included in the Company’s filings with the SEC. All information provided in this press release and in the attachments is as of the date of this press release, and the Company undertakes no obligation to update any forward-looking statement, except as required under applicable law.
The translation of Singapore Dollar amounts into United States Dollar amounts (“USD”) for the unaudited condensed interim consolidated statement of profit or loss and other comprehensive income above are included solely for the convenience of readers outside of Singapore and have been made at the rate of S$1.3534 to US$1.00, the approximate rate of exchange at March 31, 2022. Such translations should not be construed as representations that the Singapore Dollar amounts could be converted into USD at that or any other rate.
Comparison of the Three Months Ended March 31, 2022 and 2021
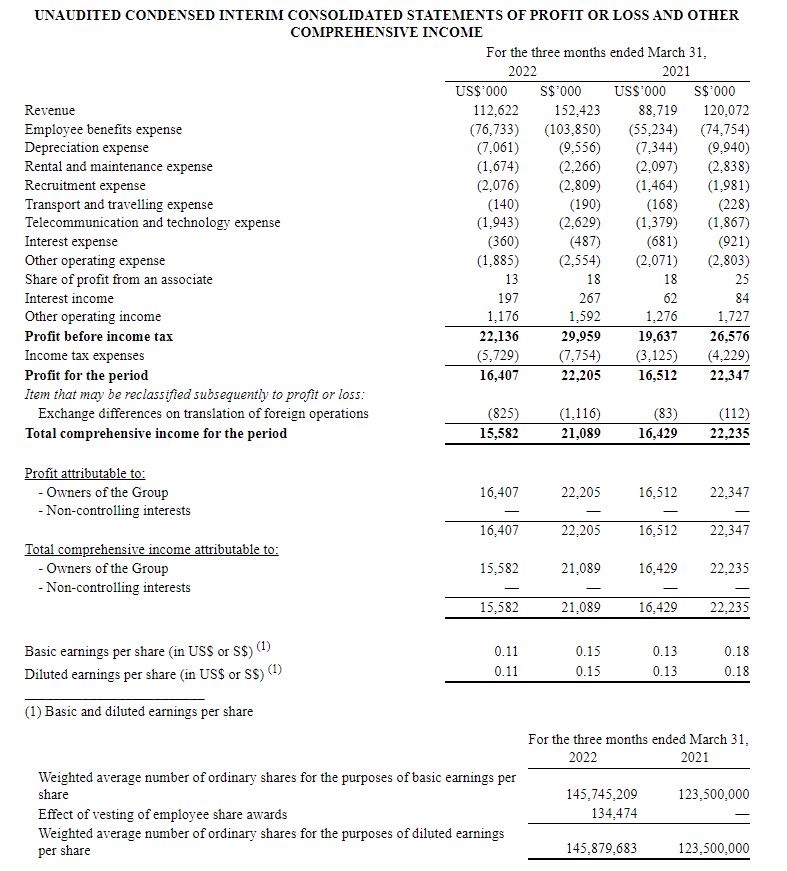
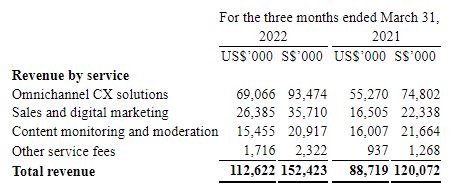
Revenue. Our revenues increased by 26.9% to S$152.4 million (US$112.6 million) for the three months ended March 31, 2022 from S$120.1 million for the three months ended March 31, 2021 primarily due to a 25.0% increase in revenue from providing omnichannel Customer Experience (“CX”) solutions, and a 59.9% increase in revenues from providing sales and digital marketing services.
• Our revenues from omnichannel CX service solutions increased by 25.0% to S$93.5 million (US$69.1 million) from S$74.8 million for the same period of 2021 primarily due to higher business volumes driven by the expansion of existing campaigns. In addition, business volumes of our top two travel and hospitality vertical clients benefited from the gradual recovery from the impact of the COVID-19 pandemic.
• Our revenues from sales and digital marketing services increased by 59.9% to S$35.7 million (US$26.4 million) from S$22.3 million for the same period of 2021 primarily due to the expansion of existing campaigns for our key clients in the digital advertising and media vertical.
• Our revenues from content monitoring and moderation services decreased slightly by 3.4% to S$20.9 million (US$15.5 million) from S$21.7 million for the same period of 2021 primarily due to lower revenue per agent from an existing client in our digital advertising and media vertical.
• Our revenues from our other service fees increased by 83.1% to S$2.3 million (US$1.7 million) from S$1.3 million for the same period of 2021 primarily due to higher contribution from existing and new clients.
The following table sets forth our service provided by amount for the three months ended March 31, 2022 and 2021.
 Employee Benefits Expense
. Our employee benefits expense increased by 38.9% to S$103.9 million (US$76.7 million) from S$74.8 million for the same period of 2021 due to higher staff force, share-based payment expense arising from the implementation of our performance share plan in November 2021, and employee compensation adjustment referenced to cost of living inflation and talent market conditions prevailing in the respective operations. Our average number of employees in the first three months of 2022 increased 29.6% compared to the same period of 2021 as a result of business volumes expansion of current campaigns over the course of 2021 and staffing requirements of new campaign launches in the second half of 2021.
Depreciation Expense. Our depreciation expense decreased by 3.9% to S$9.6 million (US$7.1 million) from S$9.9 million for the same period of 2021 primarily due to certain office renovation assets in Singapore, Thailand and Philippines being fully depreciated during the period. These were partially offset by depreciation on capital expenditures invested in new and expansion capacities to support the growth of our business.
Rental and Maintenance Expense. Our rental and maintenance expense decreased by 20.2% to S$2.3 million (US$1.7 million) from S$2.8 million for the same period of 2021 primarily due to the termination of certain co-working space memberships in Japan and Spain, subsequent to the relocation of our operations to leased and fitted-out office spaces.
Recruitment Expense. Our recruitment expense increased by 41.8% to S$2.8 million (US$2.1 million) from S$2.0 million for the same period of 2021 primarily due to increased expenses relating to higher referral and placement fees, and higher expenses associated with immigration, work permits and onboarding of foreign nationality employees induced by COVID-19-related procedural regulations implemented by governmental authorities of respective countries to support the expansion of offshore campaigns in our Singapore and Malaysia offices.
Transport and Travelling Expense. Our transport and travelling expense decreased by 16.7% to S$0.2 million (US$0.1 million) from S$0.2 million for the same period of 2021 primarily due to lower accommodation expenses.
Telecommunication and Technology Expense. Our telecommunication and technology expense increased by 40.8% to S$2.6 million (US$1.9 million) from S$1.9 million for the same period of 2021 primarily due to business volume expansion of our campaigns.
Interest Expense. Our interest expense decreased by 47.1% to S$0.5 million (US$0.4 million) from S$0.9 million for the same period of 2021 primarily due to reduced bank borrowings during the period.
Other Operating Expense. Our other operating expense decreased by 8.9% to S$2.6 million (US$1.9 million) from S$2.8 million for the same period of 2021 primarily due to lower foreign exchange losses incurred.
Share of Profit from an Associate. Our share of profit from an associate was insignificant for the three months ended March 31, 2022 and 2021.
Other Operating Income. Our other operating income decreased by 7.8% to S$1.6 million (US$1.2 million) from S$1.7 million for the same period of 2021 primarily due to lower government grants received by our Singapore subsidiaries in relation to the COVID-19 pandemic in 2022.
Profit Before Income Tax. As a result of the foregoing, our profit before income tax increased by 12.7% to S$30.0 million (US$22.1 million) from S$26.6 million for the same period of 2021.
Income Tax Expenses. Our income tax expenses increased by 83.4% to S$7.8 million (US$5.7 million) from S$4.2 million for the same period of 2021. The higher income tax expenses were mainly due to higher taxes from our subsidiary in Malaysia as a result of a one-off “prosperity tax” enacted by the local government for fiscal 2022 and higher taxable profits of several key subsidiaries.
Profit for the Period. As a result of the foregoing, our profit for the period decreased by 0.6% to S$22.2 million (US$16.4 million) from S$22.3 million for the same period of 2021.
Basic earnings per share. Our basic earnings per share decreased to S$0.15 (US$0.11) from S$0.18 (US$0.13) primarily due to an increase in the number of weighted average number of shares used to calculate basic earnings per share. On October 1, 2021, we completed our initial public offering ("IPO") of 19,358,957 American Depositary Shares (“ADSs”), each representing one Class A ordinary share of TDCX, and, on October 12, 2021, the underwriters exercised their overallotment option in respect of 2,903,843 ADSs pursuant to the option granted to the underwriters to purchase additional ADSs.
Events after March 31, 2022On April 18, 2022, 134,474 share awards of the TDCX Performance Share Plan (“PSP”) vested. Accordingly, we will issue 134,474 American Depository Shares to the participants of the TDCX PSP in due course.
NON-IFRS FINANCIAL MEASURESEBITDA, EBITDA margin, Adjusted EBITDA, Adjusted EBITDA margin, Adjusted Net Income, Adjusted Net Income margin and Adjusted EPS are non-IFRS financial measures. TDCX monitors EBITDA, EBITDA margin, Adjusted EBITDA, Adjusted EBITDA margin, Adjusted Net Income, Adjusted Net Income margin and Adjusted EPS because they assist the Company in comparing its operating performance on a consistent basis by removing the impact of items not directly resulting from its core operations.
EBITDA, EBITDA margin, Adjusted EBITDA and Adjusted EBITDA margin“EBITDA” represents profit for the period before interest expense, interest income, income tax expense, and depreciation expense. “EBITDA margin” represents EBITDA as a percentage of revenue. “Adjusted EBITDA” represents profit for the period before interest expense, interest income, income tax expense, depreciation expenses, and equity-settled share-based payment expense incurred in connection with our Performance Share Plan. “Adjusted EBITDA margin” represents Adjusted EBITDA as a percentage of revenue.
 Adjusted Net Income and Adjusted Net Income margin
“Adjusted Net Income” represents profit for the period before equity-settled share-based payment expense incurred in connection with our Performance Share Plan, net of any tax impact of such adjustments. “Adjusted Net Income margin” represents Adjusted Net Income as a percentage of revenue.
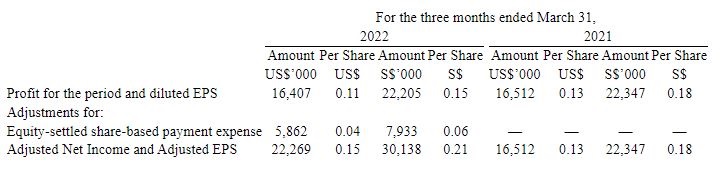
 Adjusted EPS
“Adjusted EPS” represents earnings available to shareholders excluding the impact of equity-settled share-based payment expense. Adjusted EPS is calculated as Adjusted Net Income divided by our diluted weighted-average number of shares outstanding.
The Company believes that non-IFRS financial measures such as EBITDA, EBITDA margin, Adjusted EBITDA, Adjusted EBITDA margin, Adjusted Net Income, Adjusted Net Income margin and Adjusted EPS help us to identify underlying trends in our operating results, enhancing our understanding of past performance and future prospects.
While the Company believes that the non-IFRS financial measures provide useful information to investors in understanding and evaluating the Company’s results of operations in the same manner as its management, the Company’s use of non-IFRS financial measures have limitations as analytical tools and you should not consider these in isolation or as a substitute for analysis of the Company’s results of operations or financial condition as reported under IFRS.
TDCX’s non-IFRS financial measures do not reflect all items of income and expense that affect the Company’s operations or not represent the residual cash flow available for discretionary expenditures. Further, these non-IFRS measures may differ from the non-IFRS information used by other companies, including peer companies, and therefore their comparability may be limited. The Company compensates for these limitations by reconciling the non-IFRS financial measures to the nearest IFRS performance measure, all of which should be considered when evaluating performance. The Company encourages you to review the company’s financial information in its entirety and not rely on any single financial measure.
The translation of Singapore Dollar amounts into United States Dollar amounts for the unaudited condensed interim consolidated statement of profit or loss and other comprehensive income above are included solely for the convenience of readers outside of Singapore and have been made at the rate of S$1.3534 to US$1.00, the approximate rate of exchange at March 31, 2022. Such translations should not be construed as representations that the Singapore Dollar amounts could be converted into USD at that or any other rate.
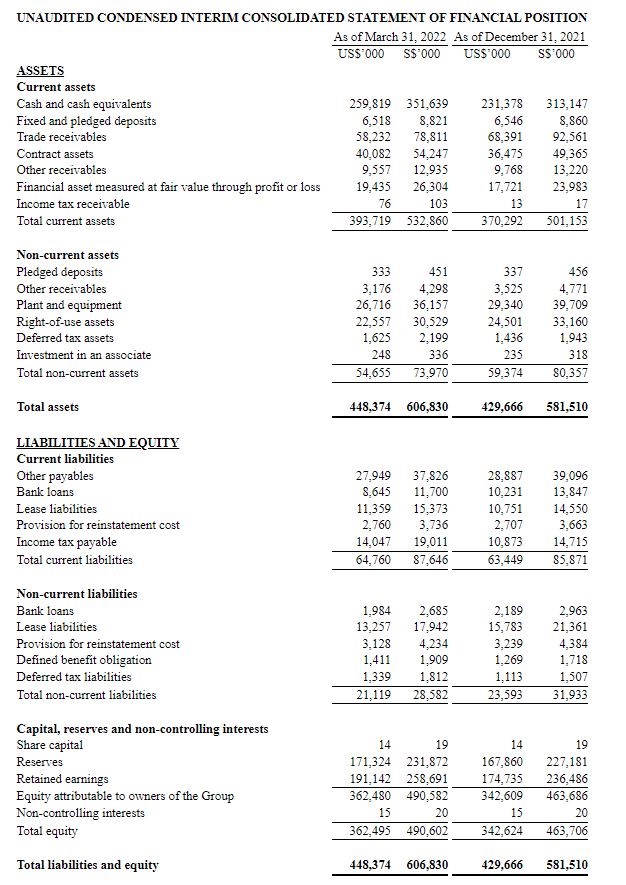
The translation of Singapore Dollar amounts into United States Dollar amounts for the unaudited condensed interim consolidated statement of financial position above are included solely for the convenience of readers outside of Singapore and have been made at the rate of S$1.3534 to US$1.00, the approximate rate of exchange at March 31, 2022. Such translations should not be construed as representations that the Singapore Dollar amounts could be converted into USD at that or any other rate.
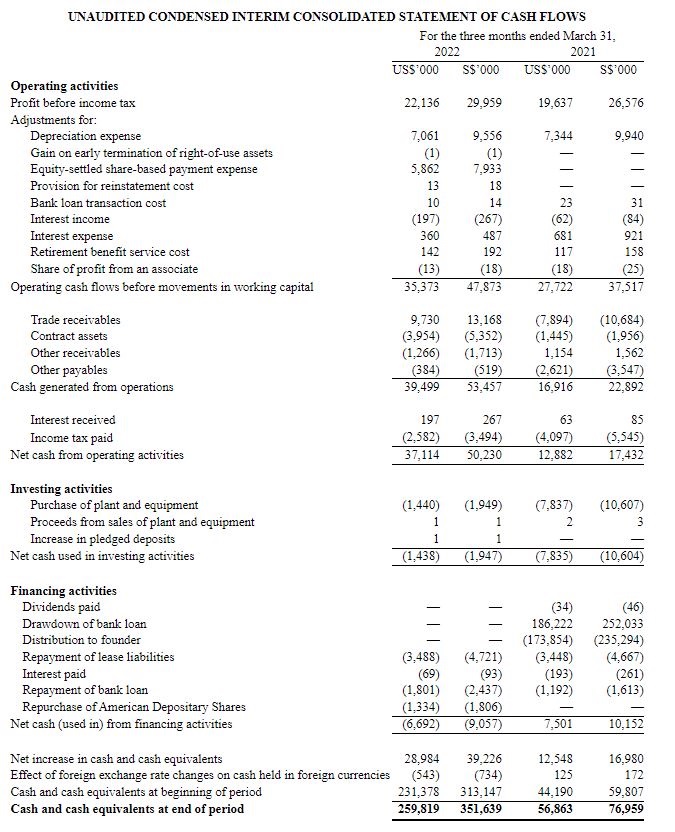
The translation of Singapore Dollar amounts into United States Dollar amounts for the unaudited condensed interim consolidated statement of cash flows above are included solely for the convenience of readers outside of Singapore and have been made at the rate of S$1.3534 to US$1.00, the approximate rate of exchange at March 31, 2022. Such translations should not be construed as representations that the Singapore Dollar amounts could be converted into USD at that or any other rate.
View source version on businesswire.com:
https://www.businesswire.com/news/home/20220525005447/en/ContactFor enquiries, please contact:Investors / Analysts: Jason Lim
+65-9799-6550
lim.jason@tdcx.com
Media: Eunice Seow
+65-8432-8388
eunice.seow@tdcx.com
Source : TDCX INC.
--BERNAMA