SINGAPORE, March 7 (Bernama-BUSINESS WIRE) -- TDCX Inc. (NYSE: TDCX) (“TDCX” or the “Company”), an award-winning digital customer experience (CX) solutions provider for technology and blue-chip companies, today announced its unaudited financial results for the fourth quarter and full year ended December 31, 2023.
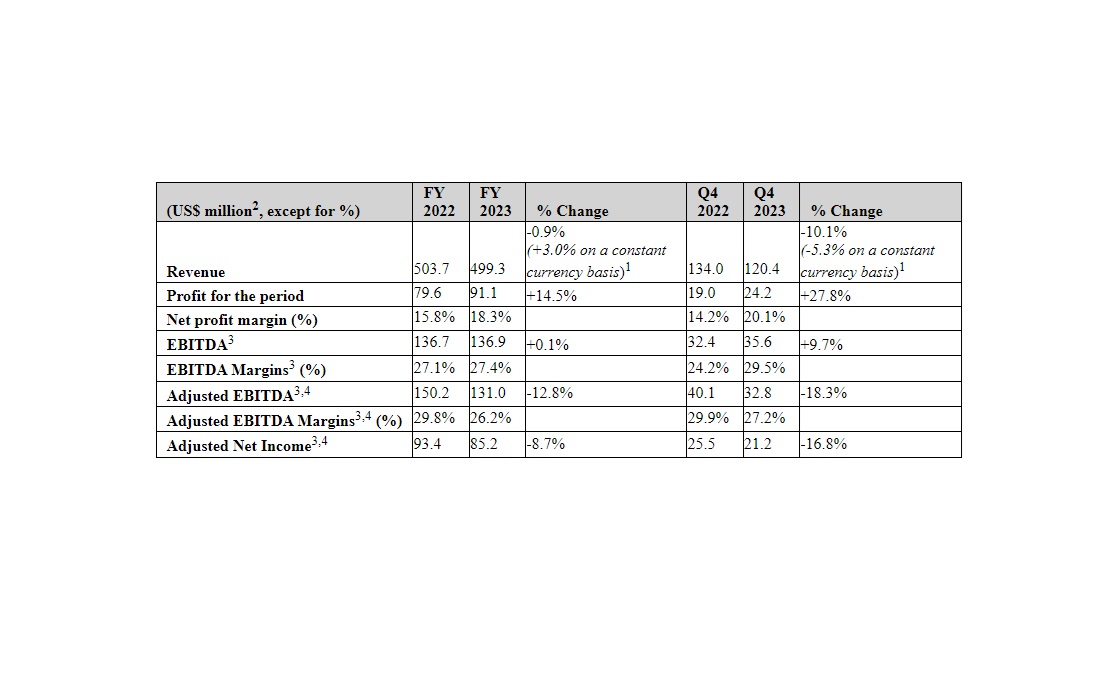
Full Year 2023 Financial Highlights²· Total revenue of US$499.3 million, down 0.9% year-on-year, or up 3.0% in constant currency terms
1, which included a 3.9% point negative impact of foreign exchange rates compared with the prior year
· Profit for the year was US$91.1 million, up 14.5% year-on-year, primarily driven by cost optimization efforts, lower tax, higher interest income and a net reversal of equity settled share-based payment expense
Fourth Quarter 2023 Financial Highlights²· Total revenue of US$120.4 million, down 10.1% year-on-year, or down 5.3% in constant currency terms
1, which included a 4.8% point negative impact of foreign exchange rates compared with the prior year period
· Profit for the period was US$24.2 million, up 27.8% year-on-year, primarily driven by cost optimization efforts, lower tax, higher interest income and a net reversal of equity settled share-based payment expense
Mr. Laurent Junique, Chief Executive Officer and Founder of TDCX, said, “Market uncertainties and a challenging macroeconomic environment continue to dampen business sentiment. This has had a knock-on impact on TDCX. Despite these pressures, we delivered within our guidance, and remain focused on the long term, particularly on improving our operations and delivering client value propositions.”
 Business HighlightsSustained client growth
· Client count⁵
up 15% year-on-year, bringing total client count to 97 as of December 31, 2023, compared with 84 as of December 31, 2022
· Newly launched clients in Q4 23 include a global digital payments company and a professional chauffeur portal
Improved revenue diversification· Revenue from clients outside the top five rose 44% year-on-year
in FY 23
· Revenue mix from top five clients lowered to 73% in FY 23, from 81% in FY 22
Contribution from new geographies· Revenue from new geographies⁶ was four times in FY 23 versus FY 22
Detailed Financial Information on the Form 6-KPlease refer to
https://investors.tdcx.com/financials/quarterly-results/default.aspx for the detailed financial information contained in Form 6-K.
__________________
¹Revenue at constant currency is calculated by translating the revenue of our local subsidiaries in each period in the respective local functional currencies to the presentation currency of the Company and its subsidiaries, using the average currency conversion rates in effect during the comparable prior period, rather than at the actual currency conversion rates in effect during the current reporting period.
²FX rate of US$1 = S$1.3186, being the approximate rate in effect as of December 31, 2023, assumed in converting financials from SG dollar to U.S. dollar.
³For a discussion of the use of non-IFRS financial measures, see “Non-IFRS Financial Measures”.
⁴The reported amounts for Adjusted EBITDA and Adjusted Net Income for the three months and full year ended December 31, 2023 include adjustments for certain items (i.e., acquisition-related professional fees and net foreign exchange gains or losses) which were not included in similar non-IFRS financial measures previously reported in prior periods. The amount of adjustment for net foreign exchange loss or gain previously reported in prior periods did not include unrealized losses or gains resulting from change in fair value of derivatives. In order to place the current disclosure in the appropriate context and enhance its comparability, similar adjustments have been made for net foreign exchange loss and net foreign exchange gain, Adjusted EBITDA and Adjusted Net Income for the three months and full year ended December 31, 2022.
⁵“Client count” refers to launched campaigns that are revenue generating.
⁶Refers to sites in Colombia, India, Romania, South Korea, Hong Kong, Türkiye, Vietnam, Brazil and Indonesia.
Webcast and Conference Call InformationThe Company will not host a conference call to discuss the results. Please reach out to the Investor Relations or Public Relations contacts listed below with any questions.
About TDCX INC.Singapore-headquartered TDCX provides transformative digital CX solutions, enabling world-leading and disruptive brands to acquire new customers, to build customer loyalty and to protect their online communities.
TDCX helps clients achieve their customer experience aspirations by harnessing technology, human intelligence and its global footprint. It serves clients in fintech, gaming, technology, travel and hospitality, digital advertising and social media, streaming and e-commerce. TDCX’s expertise and strong footprint in Asia has made it a trusted partner for clients, particularly high-growth, new economy companies, looking to tap the region’s growth potential.
TDCX’s commitment to delivering positive outcomes for our clients extends to its role as a responsible corporate citizen. Its Corporate Social Responsibility program focuses on positively transforming the lives of its people, its communities and the environment.
TDCX employs more than 17,800 employees across 30 campuses globally, specifically in Brazil, Colombia, Hong Kong, India, Indonesia, Japan, Malaysia, Mainland China, Philippines, Romania, Singapore, South Korea, Spain, Thailand, Türkiye, and Vietnam. For more information, please visit
www.tdcx.com.
Convenience TranslationThe Company’s financial information is stated in Singapore dollars, the legal currency of Singapore. Unless otherwise noted, all translations from Singapore dollars to U.S. dollars and from U.S. dollars to Singapore dollars in this press release were made at a rate of S$1.3186 to US$1.00, the approximate rate in effect as of December 31, 2023. We make no representation that any Singapore dollar or U.S. dollar amount could have been, or could be, converted into U.S. dollars or Singapore dollar, as the case may be, at any particular rate, the rate stated herein, or at all.
Non-IFRS Financial MeasuresTo supplement our consolidated financial statements, which are prepared and presented in accordance with IFRS, we use the following non-IFRS financial measures to help evaluate our operating performance:
“EBITDA” represents profit for the year/ period before interest expense, interest income, income tax expense and depreciation and amortization expense. “EBITDA margin” represents EBITDA as a percentage of revenue.
“Adjusted EBITDA” represents profit for the year/ period before interest expense, interest income, income tax expense, depreciation and amortization expense, acquisition-related professional fees, net foreign exchange gains or losses and equity-settled share-based payment expense (or net reversal) incurred in connection with our Performance Share Plan. “Adjusted EBITDA margin” represents Adjusted EBITDA as a percentage of revenue.
“Adjusted Net Income” represents profit for the year/ period before acquisition-related professional fees, net foreign exchange gains or losses and equity-settled share-based payment expense (or net reversal) incurred in connection with our Performance Share Plan, net of any tax impact of such adjustments.
Revenue at constant currency is calculated by translating the revenue of our local subsidiaries in each period in the respective local functional currencies to the presentation currency of the Company and its subsidiaries, using the average currency conversion rates in effect during the comparable prior period, rather than at the actual currency conversion rates in effect during the current reporting period.
We believe that EBITDA, EBITDA Margin, Adjusted EBITDA, Adjusted EBITDA Margin, Adjusted Net Income, Revenue at Constant Currency and Revenue Growth at Constant Currency help us to compare our operating performance on a consistent basis by removing the impact of items not directly resulting from our core operations, and thereby help us to identify underlying trends in our operating results, enhancing our understanding of past performance and future prospects.
We exclude items from Adjusted EBITDA and Adjusted Net Income, including acquisition-related professional fees, net foreign exchange gains or losses and equity-settled share-based payment expense (or net reversal) incurred in connection with our Performance Share Plan, as they are not indicative of our ongoing operating performance, and adjusting for such items is meaningful and useful to readers to understand the underlying performance of the business by eliminating the impact of certain items that may obscure trends in the underlying performance of the business.
The above non-IFRS financial measures have limitations as analytical tools and should not be considered in isolation or construed as an alternative to revenue, net income, or any other measure of performance or as an indicator of our operating performance. The non-IFRS financial measures presented here may not be comparable to similarly titled measures presented by other companies because other companies may calculate similarly titled measures differently. For more information on the non-IFRS financial measures, including full reconciliations to the nearest IFRS measure, please see the form 6-K section captioned “Non-IFRS Financial Measures” or the presentation slides.
Safe Harbor StatementThis announcement contains forward-looking statements. These statements are made under the “safe harbor” provisions of the U.S. Private Securities Litigation Reform Act of 1995. In some cases, you can identify these forward-looking statements by the use of words such as “outlook,” “believes,” “expects,” “potential,” “continues,” “may,” “will,” “should,” “could,” “seeks,” “predicts,” “intends,” “trends,” “plans,” “estimates,” “anticipates” or the negative version of these words or other comparable words. The Company may also make written or oral forward-looking statements in its periodic reports to the U.S. Securities and Exchange Commission (the “SEC”), in its annual report to shareholders, in press releases and other written materials and in oral statements made by its officers, directors or employees to third parties. Statements that are not historical facts, including statements about the Company’s beliefs and expectations, are forward-looking statements. Forward-looking statements involve inherent risks and uncertainties. A number of factors could cause actual results to differ materially from those contained in any forward-looking statement, including but not limited to the following: the performance of TDCX’s largest clients; the successful implementation of its business strategy; the continued service of the Founder and certain of its key employees and management; its ability to compete effectively; its ability to navigate difficulties and successfully expand its operations into countries in which it has no prior operating experience; its ability to maintain its pricing, control costs or continue to grow its business; its ability to attract and retain enough highly trained employees; its compliance with service level and performance requirements by, and contractual obligations with, its clients; its exposure to various risks in Southeast Asia and other parts of the world; its contractual relationship with key clients; clients and prospective clients’ spending on omnichannel CX solutions and content, trust and safety services; its ability to successfully identify, acquire and integrate companies; its spending on employee salaries and benefits expenses; and its involvement in any disputes, legal, regulatory, and other proceedings arising out of its business operations. Further information regarding these and other risks is included in the Company’s filings with the SEC. All information provided in this press release and in its attachment is as of the date of this press release, and the Company undertakes no obligation to update any forward-looking statement, except as required under applicable law.
UNAUDITED CONDENSED INTERIM CONSOLIDATED STATEMENT OF PROFIT OR LOSS AND OTHER COMPREHENSIVE INCOMEThe translation of Singapore Dollar amounts into United States Dollar amounts (“USD”) for the unaudited condensed interim consolidated statement of profit or loss and other comprehensive income above are included solely for the convenience of readers outside of Singapore and have been made at the rate of S$1.3186 to US$1.00, the approximate rate of exchange at December 31, 2023. Such translations should not be construed as representations that the Singapore Dollar amounts could be converted into USD at that or any other rate.
Comparison of the Three Months Ended December 31, 2023 and 2022Revenue. Our revenue decreased by 10.1% to S$158.8 million (US$120.4 million) for the three months ended December 31, 2023 from S$176.7 million for the three months ended December 31, 2022 primarily driven by a 36.7% decrease in revenue from content, trust and safety services, a 12.1% decrease in revenue from sales and digital marketing services and 1.9% decrease in revenue from omnichannel CX solutions services rendered. Revenue from other services increased by 20.9%.
· Our revenue from omnichannel CX solutions services decreased by 1.9% to S$96.5 million (US$73.2 million) from S$98.5 million for the corresponding period of 2022 primarily impacted by lower volumes requirement by existing clients in the digital advertising and media and fintech sectors, buffered partially by increased demand by clients in the gaming, technology, travel and hospitality, e-commerce, fast-moving consumer goods verticals and new food delivery customer.
· Our revenue from sales and digital marketing services decreased by 12.1% to S$43.0 million (US$32.6 million) from S$48.9 million for the same period of 2022 mainly attributed to declined volume requirements of existing campaign by key digital advertising clients and media and e-commerce sectors.
· Our revenue from content, trust and safety services decreased by 36.7% to S$17.7 million (US$13.5 million) from S$28.1 million for the same period of 2022 primarily due to the contraction of volumes requirement by the digital advertising and media vertical client.
· Our revenue from our other service fees increased by 20.9% to S$1.5 million (US$1.1 million) from S$1.2 million for the same period of 2022 primarily due to an expansion of existing campaigns.
The following table sets forth our service provided by amount for the three months ended December 31, 2023 and 2022.
For the three months ended December 31Employee Benefits Expense. Our employee benefits expense decreased by 14.5% to S$98.2 million (US$74.5 million) from S$114.8 million for the same period of 2022 due mainly to a reversal of equity-settled share-based payment expense resulting from revised vesting expectation of the remaining tranche against the backdrop of more headwinds in the recent business dynamics that also contributed to the lower headcount volume requirements by customer campaigns.
Depreciation and Amortization Expense. Our depreciation and amortization expense remained stable during the two comparative periods.
Rental and Maintenance Expense. Our rental and maintenance expenses decreased by 10.9% to S$2.4 million (US$1.8 million) from S$2.7 million for the same period of 2022 primarily due to the decreased technology device renting and relocation of office space by the Korean unit from co-working space to a long term leased facilities in 2023.
Recruitment Expense. Our recruitment expense decreased by 24.7% to S$2.6 million (US$1.9 million) from S$3.4 million for the same period of 2022, primarily due to lower hiring activities in several key operating sites reflecting the volume downturn.
Transport and Travelling Expense. Our transport and travelling expenses decreased by 35.1% to S$0.4 million (US$0.3 million) from S$0.7 million for the same period of 2022 primarily due to lower logistical costs incurred by the Philippines site on the back of the reduction in the remote and work from home working arrangements in 2023.
Telecommunication and Technology Expense. Our telecommunication and technology expenses remained stable during the two comparative periods.
Interest Expense. Our interest expense increased by 8.7% to $0.6 million (US$0.5 million) from $0.5 million for the same period of 2022 on account of mainly higher lease liability interest from office spaces taken up by new and existing sites.
Other Operating Expense. Our other operating expense decreased by 29.9% to S$6.6 million (US$5.0 million) from S$9.5 million for the same period of 2022 primarily due to lower net foreign exchange loss.
Share of Profit from an Associate. This relates to our share of profit from an associated company in Hong Kong which later became a wholly-owned subsidiary on October 13, 2022 following the acquisition of the controlling shares in that business.
Interest Income. Our interest income increased by 146.5% to S$3.5 million (US$2.7 million) from S$1.4 million for the same period of 2022 primarily due to higher placements of excess liquid funds in interest earning deposits as well as the increase in interest rates in 2023.
Other Operating Income. Our other operating income increased by 280.5% to S$1.5 million (US$1.1 million) from S$0.4 million for the same period of 2022 primarily due to the increase in the fair value gain of financial assets measured at fair value through profit or loss.
Profit Before Income Tax. As a result of the foregoing, we achieved a profit before income tax of S$39.1 million (US$29.7 million) for the three months ended December 31, 2023 (S$33.0 million for the corresponding period of 2022).
Income Tax Expense. Our income tax expense decreased by 10.1% to S$7.1 million (US$5.4 million) from S$7.9 million for the same period of 2022 primarily due to the reinstatement of tax incentive in the Philippines that was suspended in 2022 and one-off prosperity tax levied in Malaysia that was implemented in 2022.
Profit for the Period. As a result of the foregoing, our profit for the period increased by 27.8% to S$32.0 million (US$24.2 million) from S$25.0 million for the same period of 2022.
Exchange differences on translation of foreign operations. Exchange differences on translation of foreign operations recognized in other comprehensive income was a loss of S$11.0 million (US$8.3 million) and a loss of S$16.2 million for the same period in 2022, resulting from the strengthening of the Singapore Dollar against the respective functional currencies of the foreign operations. The exchange losses on translation of foreign operations for the period decreased by 32.3% as compared to the same period in 2022 as the extent of strengthening of the Singapore Dollar against those functional currencies is lesser in 2023.
Total Comprehensive Income for the Period. As a result of the foregoing, our total comprehensive income for the period increased by 114.9% to S$21.0 million (US$15.9 million) from S$9.8 million for the same period of 2022.
Additional Adjustments to Certain Non-IFRS Financial MeasuresWith effect from January 1, 2023, we have decided to include adjustments for net foreign exchange gains or losses and acquisition-related professional fees in Adjusted EBITDA, Adjusted Net Income and Adjusted EPS, in addition to an adjustment for equity-settled share-based payment expense (or net reversal) that was included in such previously reported non-IFRS measures in prior periods. Over the course of the previous year, we have identified such additional items as not indicative of our ongoing operating performance, and adjusting for such items is meaningful and useful to readers to understand the underlying performance of the business by eliminating the impact of certain items that may obscure trends in the underlying performance of the business. For further information, see “Non-IFRS Financial Measures” below.
Share Repurchase ProgramOn March 14, 2022, we announced that the board of directors had approved a US$30.0 million share repurchase program. The share repurchase program commenced on March 14, 2022. The repurchase program has no expiration date and may be suspended, modified or discontinued at any time without prior notice. We expect to fund repurchases under this program with our existing cash balance.
Our proposed repurchases may be made from time to time on the open market at prevailing market prices, in privately negotiated transactions, in block trades, and/or through other legally permissible means, depending on market conditions and in accordance with applicable rules and regulations and its insider trading policy. Our board of directors will review the share repurchase program periodically and may authorize adjustment of its terms and size. All share repurchases are subject to and will be carried out, if at all, in accordance with applicable regulatory requirements.
From October 1, 2023 to December 31, 2023, we purchased 418,187 American Depositary Shares (ADSs) at a cost of
US$2,169,000 under our share repurchase program. No repurchases of ADSs were made from January 1, 2024 to March 4, 2024.
NON-IFRS FINANCIAL MEASURESEBITDA, EBITDA margin, Adjusted EBITDA, Adjusted EBITDA margin, Adjusted Net Income, Adjusted Net Income margin, Adjusted EPS, revenue at constant currency, and revenue growth at constant currency are non-IFRS financial measures. TDCX monitors EBITDA, EBITDA margin, Adjusted EBITDA, Adjusted EBITDA margin, Adjusted Net Income, Adjusted Net Income margin, Adjusted EPS, revenue at constant currency and revenue growth at constant currency because they assist the Company in comparing its operating performance on a consistent basis by removing the impact of items not directly resulting from its core operations.
EBITDA, EBITDA margin, Adjusted EBITDA and Adjusted EBITDA margin“EBITDA” represents profit for the period before interest expense, interest income, income tax expense, and depreciation and amortization expense. “EBITDA margin” represents EBITDA as a percentage of revenue. “Adjusted EBITDA” represents profit for the period before interest expense, interest income, income tax expense, depreciation and amortization expense, equity-settled share-based payment expense (or net reversal) incurred in connection with our Performance Share Plan, net foreign exchange gain or loss and acquisition-related professional fees. “Adjusted EBITDA margin” represents Adjusted EBITDA as a percentage of revenue.
For the three months ended December 31(¹) Refer to equity-settled share-based payment expense (or net reversal) arising from TDCX Performance Share Plan.
(²) Refer to realized and unrealized losses or gains resulting from changes in exchange rates between the functional currency and the currency in which a foreign currency transaction is denominated, net of unrealized losses or gains resulting from change in fair value of derivatives. The amount of adjustment for net foreign exchange loss or gain previously reported in prior periods did not include unrealized losses or gains resulting from change in fair value of derivatives. In order to place the current disclosure in the appropriate context and enhance its comparability, similar adjustments have been made for net foreign exchange loss and net foreign exchange gain for the three months and full year ended December 31, 2022.
(³) Refer to fees incurred on third-party service providers in connection with a discontinued acquisition.
(⁴) The reported amounts for Adjusted EBITDA for the three months ended December 31, 2023 include adjustments for certain items (i.e., acquisition-related professional fees and net foreign exchange gains or losses) which were not included in similar non-IFRS financial measures previously reported in prior periods. In order to place the current disclosure in the appropriate context and enhance its comparability, similar adjustments have been made for Adjusted EBITDA for the three months ended December 31, 2022.
(⁵) The reported amounts for Adjusted EBITDA for the full year ended December 31, 2023 include adjustments for certain items (i.e., acquisition-related professional fees and net foreign exchange gains or losses) which were not included in similar non-IFRS financial measures previously reported in prior periods. In order to place the current disclosure in the appropriate context and enhance its comparability, similar adjustments have been made for Adjusted EBITDA for the full year ended December 31, 2022.
Adjusted Net Income and Adjusted Net Income margin“Adjusted Net Income” represents profit for the period before equity-settled share-based payment expense (or net reversal) incurred in connection with our Performance Share Plan, net foreign exchange gain or loss and acquisition-related professional fees, net of any tax impact of such adjustments. “Adjusted Net Income margin” represents Adjusted Net Income as a percentage of revenue.
For the three months ended December 31(¹) Refer to equity-settled share-based payment expense (or net reversal) arising from TDCX Performance Share Plan.
(²) Refer to realized and unrealized losses or gains resulting from changes in exchange rates between the functional currency and the currency in which a foreign currency transaction is denominated, net of unrealized losses or gains resulting from change in fair value of derivatives and net of tax effects. The amount of adjustment for net foreign exchange loss or gain previously reported in prior periods did not include unrealized losses or gains resulting from change in fair value of derivatives. In order to place the current disclosure in the appropriate context and enhance its comparability, similar adjustments have been made for net foreign exchange loss and net foreign exchange gain for the three months and full year ended December 31, 2022.
(³) Refer to fees incurred on third-party service providers in connection with a discontinued acquisition.
(⁶) The reported amounts for Adjusted Net Income for the three months ended December 31, 2023 include adjustments for certain items (i.e., acquisition-related professional fees and net foreign exchange gains or losses) which were not included in similar non-IFRS financial measures previously reported in prior periods. In order to place the current disclosure in the appropriate context and enhance its comparability, similar adjustments have been made for Adjusted Net Income for the three months ended December 31, 2022.
(⁵) The reported amounts for Adjusted Net Income for the full year ended December 31, 2023, include adjustments for certain items (i.e., acquisition-related professional fees and net foreign exchange gains or losses) which were not included in similar non-IFRS financial measures previously reported in prior periods. In order to place the current disclosure in the appropriate context and enhance its comparability, similar adjustments have been made for Adjusted Net Income for the full year ended December 31, 2022.
Adjusted EPS“Adjusted EPS” represents earnings available to shareholders excluding the impact of equity-settled share-based payment expense (or net reversal), net foreign exchange gain or loss and acquisition-related professional fees.
Adjusted EPS is calculated as earnings available to shareholders excluding the impact of equity-settled share-based payment expense (or net reversal), net foreign exchange gain or loss and acquisition-related professional fees, divided by the diluted weighted-average number of shares outstanding.
For the three months ended December 31
(¹) Refer to equity-settled share-based payment expense arising from TDCX Performance Share Plan.
(²) Refer to realized and unrealized losses or gains resulting from changes in exchange rates between the functional currency and the currency in which a foreign currency transaction is denominated, net of unrealized losses or gains resulting from change in fair value of derivatives and net of tax effects. The amount of adjustment for net foreign exchange loss or gain previously reported in prior periods did not include unrealized losses or gains resulting from change in fair value of derivatives. In order to place the current disclosure in the appropriate context and enhance its comparability, similar adjustments have been made for net foreign exchange loss and net foreign exchange gain for the three months and full year ended December 31, 2022.
(³) Refer to fees incurred on third-party service providers in connection with a discontinued acquisition.
(⁴
) The reported amounts for Adjusted EPS for the three months ended December 31, 2023 include adjustments for certain items (i.e., acquisition-related professional fees and net foreign exchange gains or losses) which were not included in similar non-IFRS financial measures previously reported in prior periods. In order to place the current disclosure in the appropriate context and enhance its comparability, similar adjustments have been made for Adjusted EPS for the three months ended December 31, 2022.
(⁵) The reported amounts for Adjusted EPS for the full year ended December 31, 2023 include adjustments for certain items (i.e., acquisition-related professional fees and net foreign exchange gains or losses) which were not included in similar non-IFRS financial measures previously reported in prior periods. In order to place the current disclosure in the appropriate context and enhance its comparability, similar adjustments have been made for Adjusted EPS for the full year ended December 31, 2022.
Revenue at Constant Currency and Revenue Growth at Constant CurrencyRevenue at constant currency, which is revenue adjusted for the translation effect of foreign currencies so that certain financial results can be viewed without the impact of fluctuations in foreign currency exchange rates, thereby facilitating period-to-period comparisons of our business performance. Revenue at constant currency is calculated by translating the revenue of our local subsidiaries in each period in the respective local functional currencies to TDCX Inc.’s and its consolidated subsidiaries’ (together, the “Group”) presentation currency, using the average currency conversion rates in effect during the comparable prior period (rather than at the actual currency conversion rates in effect during the current reporting period). Revenue growth at constant currency means the period-over-period change in revenue at constant currency compared against revenue in the prior period.
For the three months ended December 31The Company has not reconciled non-IFRS forward-looking revenue growth at constant currency to its most directly comparable IFRS measure, as permitted by Item 10(e)(1)(i)(B) of Regulation S-K. The revenue growth outlook indicated for 2024 is calculated and presented at constant currency, as it would require unreasonable efforts to predict factors that are out of the Company’s control or are not readily predictable, such as currency exchange movements over the course of an entire year.
The Company uses revenue at constant currency and revenue growth at constant currency, which are supplemental non-IFRS financial measures, to provide better comparability of revenue trends period-over-period (without the impact of fluctuations in foreign currency exchange rates) because it is a global company that transacts business in multiple currencies and reports financial information in the Group’s functional reporting currency. Foreign currency exchange rate fluctuations affect the amounts reported by the Company in the Group’s functional reporting currency with respect to its foreign revenues. Generally, when the Group’s functional reporting currency dollar either strengthens or weakens against other currencies, revenue at constant currency rates and revenue growth at constant currency rates will be higher or lower than revenue and revenue growth reported at actual exchange rates.
The Company believes that non-IFRS financial measures such as EBITDA, EBITDA margin, Adjusted EBITDA, Adjusted EBITDA margin, Adjusted Net Income, Adjusted Net Income margin, Adjusted EPS, revenue at constant currency and revenue growth at constant currency help us to identify underlying trends in our operating results, enhancing our understanding of past performance and future prospects.
While the Company believes that such non-IFRS financial measures provide useful information to investors in understanding and evaluating the Company’s results of operations in the same manner as its management, the Company’s use of such non-IFRS financial measures have limitations as analytical tools and you should not consider these in isolation or as a substitute for analysis of the Company’s results of operations or financial condition as reported under IFRS.
TDCX’s non-IFRS financial measures do not reflect all items of income and expense that affect the Company’s operations and do not represent the residual cash flow available for discretionary expenditures. Further, these non-IFRS measures may differ from the non-IFRS information used by other companies, including peer companies, and therefore their comparability may be limited. The Company compensates for these limitations by reconciling the non-IFRS financial measures to the nearest IFRS performance measure, all of which should be considered when evaluating performance. The Company encourages you to review the company’s financial information in its entirety and not rely on any single financial measure.
The translation of Singapore Dollar amounts into United States Dollar amounts for the unaudited condensed interim consolidated statement of profit or loss and other comprehensive income above are included solely for the convenience of readers outside of Singapore and have been made at the rate of S$1.3186 to US$1.00, the approximate rate of exchange at December 31, 2023. Such translations should not be construed as representations that the Singapore Dollar amounts could be converted into USD at that or any other rate.
UNAUDITED CONDENSED INTERIM CONSOLIDATED STATEMENT OF PROFIT OR LOSS AND OTHER COMPREHENSIVE INCOMEUNAUDITED CONDENSED INTERIM CONSOLIDATED STATEMENT OF FINANCIAL POSITIONThe translation of Singapore Dollar amounts into United States Dollar amounts for the unaudited condensed interim consolidated statement of financial position above are included solely for the convenience of readers outside of Singapore and have been made at the rate of S$1.3186 to US$1.00, the approximate rate of exchange at December 31, 2023. Such translations should not be construed as representations that the Singapore Dollar amounts could be converted into USD at that or any other rate.
(¹) As at December 31, 2023, we have segregated the Other payable balance reported in prior periods’ statement of financial position to Trade Payable and Accrued Operating Expenses to better reflect the nature of payables. As a result, the comparative figures in the statement of financial position of December 31, 2022 have been adjusted to conform to the current year’s presentation.
UNAUDITED CONDENSED INTERIM CONSOLIDATED STATEMENT OF CASH FLOWSThe translation of Singapore Dollar amounts into United States Dollar amounts for the unaudited condensed interim consolidated statement of cash flows above are included solely for the convenience of readers outside of Singapore and have been made at the rate of S$1.3186 to US$1.00, the approximate rate of exchange at December 31, 2023. Such translations should not be construed as representations that the Singapore Dollar amounts could be converted into USD at that or any other rate.